Are You're Running Data-Driven Retrospectives

Edo Williams
Edo Williams
In many of the retros I’ve facilitated, I’m surprised by how uninterested many people are in data. Even analytical IT professionals tend to overlook all but the most basic data. Many times participants end up presenting what they believe is a fact as the truth because it feels real to them. In reality, everyone experiences the world in a very different way and their version of the facts may or may not be true.
Without some guidelines, it becomes difficult to separate objective truth and subjective experience.
This is why gathering good data is vital. Sound data allows teams to share a common understanding of what happened in their sprint. In turn, this enables more meaningful conversations about improving broken processes.
What data should you gather and bring to your next retrospective and how can you best use the data you collect?
Retrospective with no Data

Let me walk you through a retro I conducted a few years ago. I asked my team to take a few minutes to write down problems they had faced during their last sprint. I set a timer for five minutes and they began jotting down details.
Some of my team started to write while others started to stare into space scratching their heads wondering, “what went wrong during the last sprint?” Too much time had passed, and they were focused on coding that they’d already forgotten what happened yesterday let alone two weeks before.
Soon the timer beeped and I asked what we had so far. Time was up.
One participant complained that there were too many priority requests to fix production bugs, and not enough time to finish their stories. Another member disagreed citing a chronic problem of overcommitment and underestimation.
Sound familiar? If so let’s explore why data is important when running a retrospective.
What kinds of data do we gather? There are two types of data to consider — unbiased and personal data. Let’s get into the details.
What kinds of data do we gather?
Unbiased data is information that we can measure and verify. There are potentially hundreds of items to track, but I’ll focus on these:
- Burndown chart
- Cycle time and time in status
- Stakeholder satisfaction
- Meeting time
- Support requests
- Time spent on bugs
Burn Down Chart
Let’s start by showing what a burn-down chart looks like. This is commonly used in the sprint process.
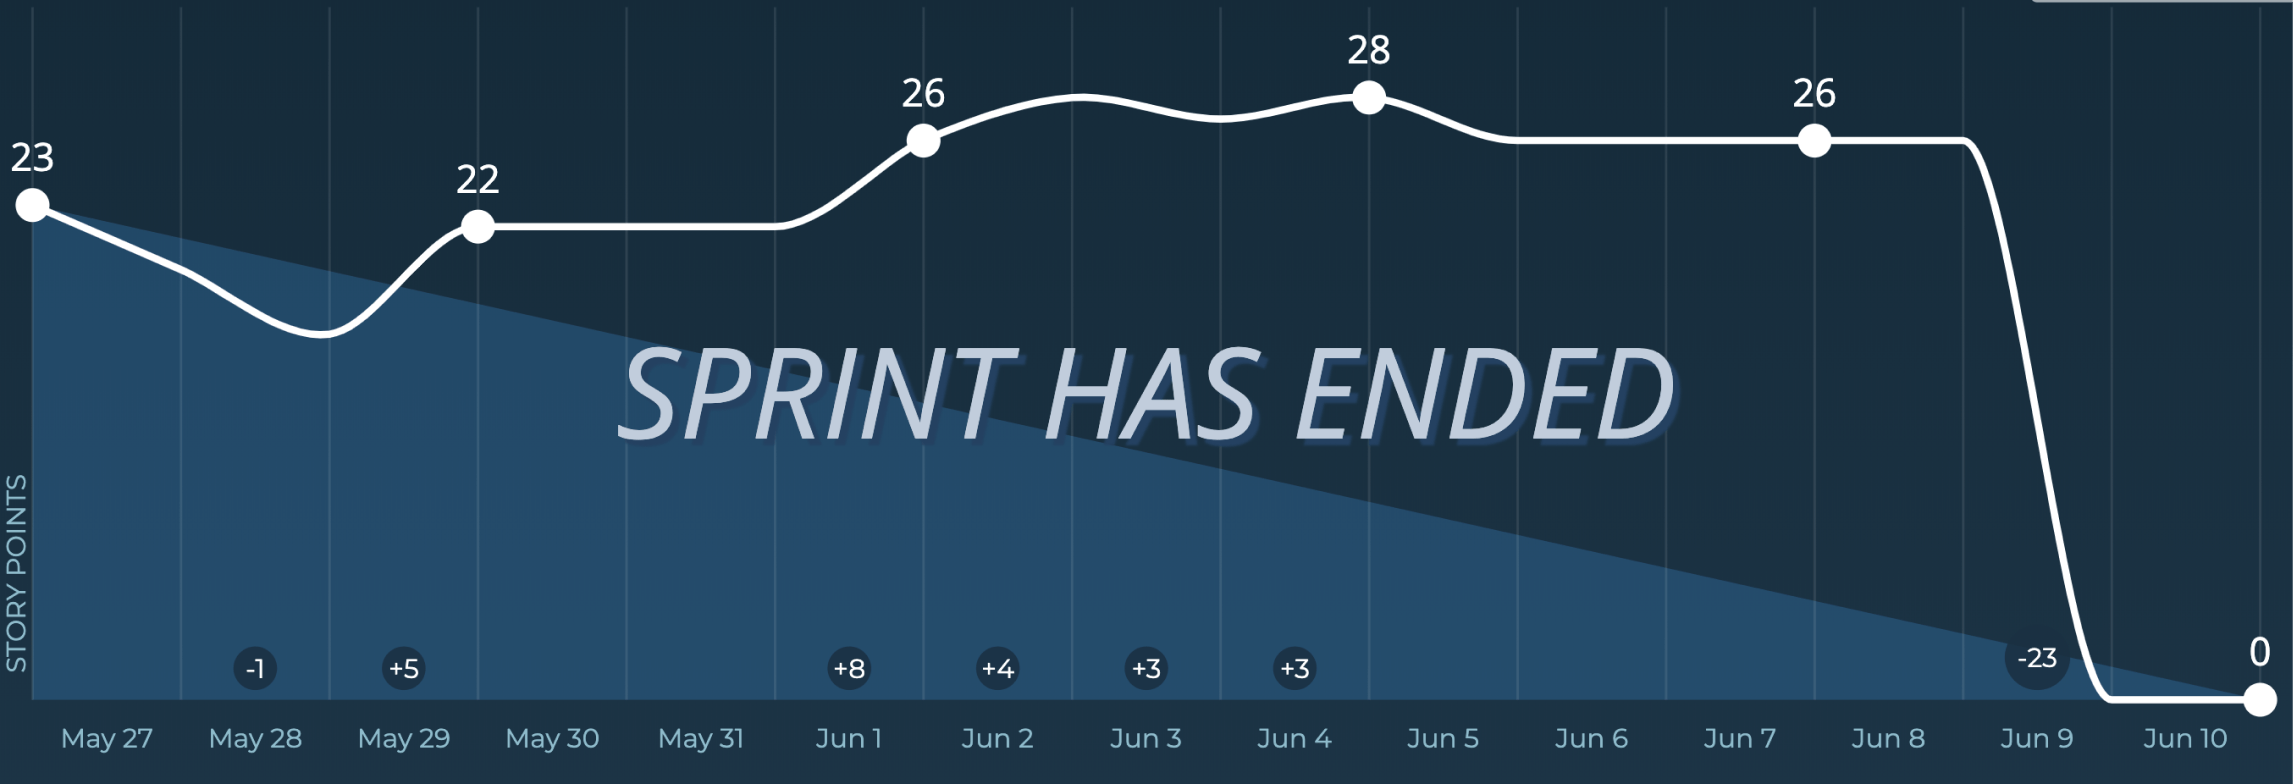
The image you see above is a burndown chart, the y-axis shows the amount of work left and the x-axis represents time.
The scenario above shows a team starting out fast and then having a very steep drop at the end of the sprint.
There are a few questions that come to mind when you look at this chart.
- Can we avoid repeating this steep drop during the next sprint?
- Why is there a sudden drop at the end of the sprint? Did the team complete the sprint stories at the end of the sprint?
- Why was there an increase in stories in the middle of the sprint? Did something happen in the middle of the sprint that distracted us from getting our work done?
- Were the stories pointed, groomed and understandable?
- Did we underestimate during sprint planning? Were the tasks too complex, If so, what can we do to understand them better in the future?
Cycle Time and Time in Status
Cycle time is the total time it takes for a task to be completed. Let’s run down an example of how this is calculated.
If a team starts work at 8:00 am Monday and finishes at 8:00 am Friday, the cycle time is two days. So using this example we can calculate cycle time for anything we work on in a sprint — user stories, bugs, tasks and so forth. Once this data is in place we can create a graph like this:
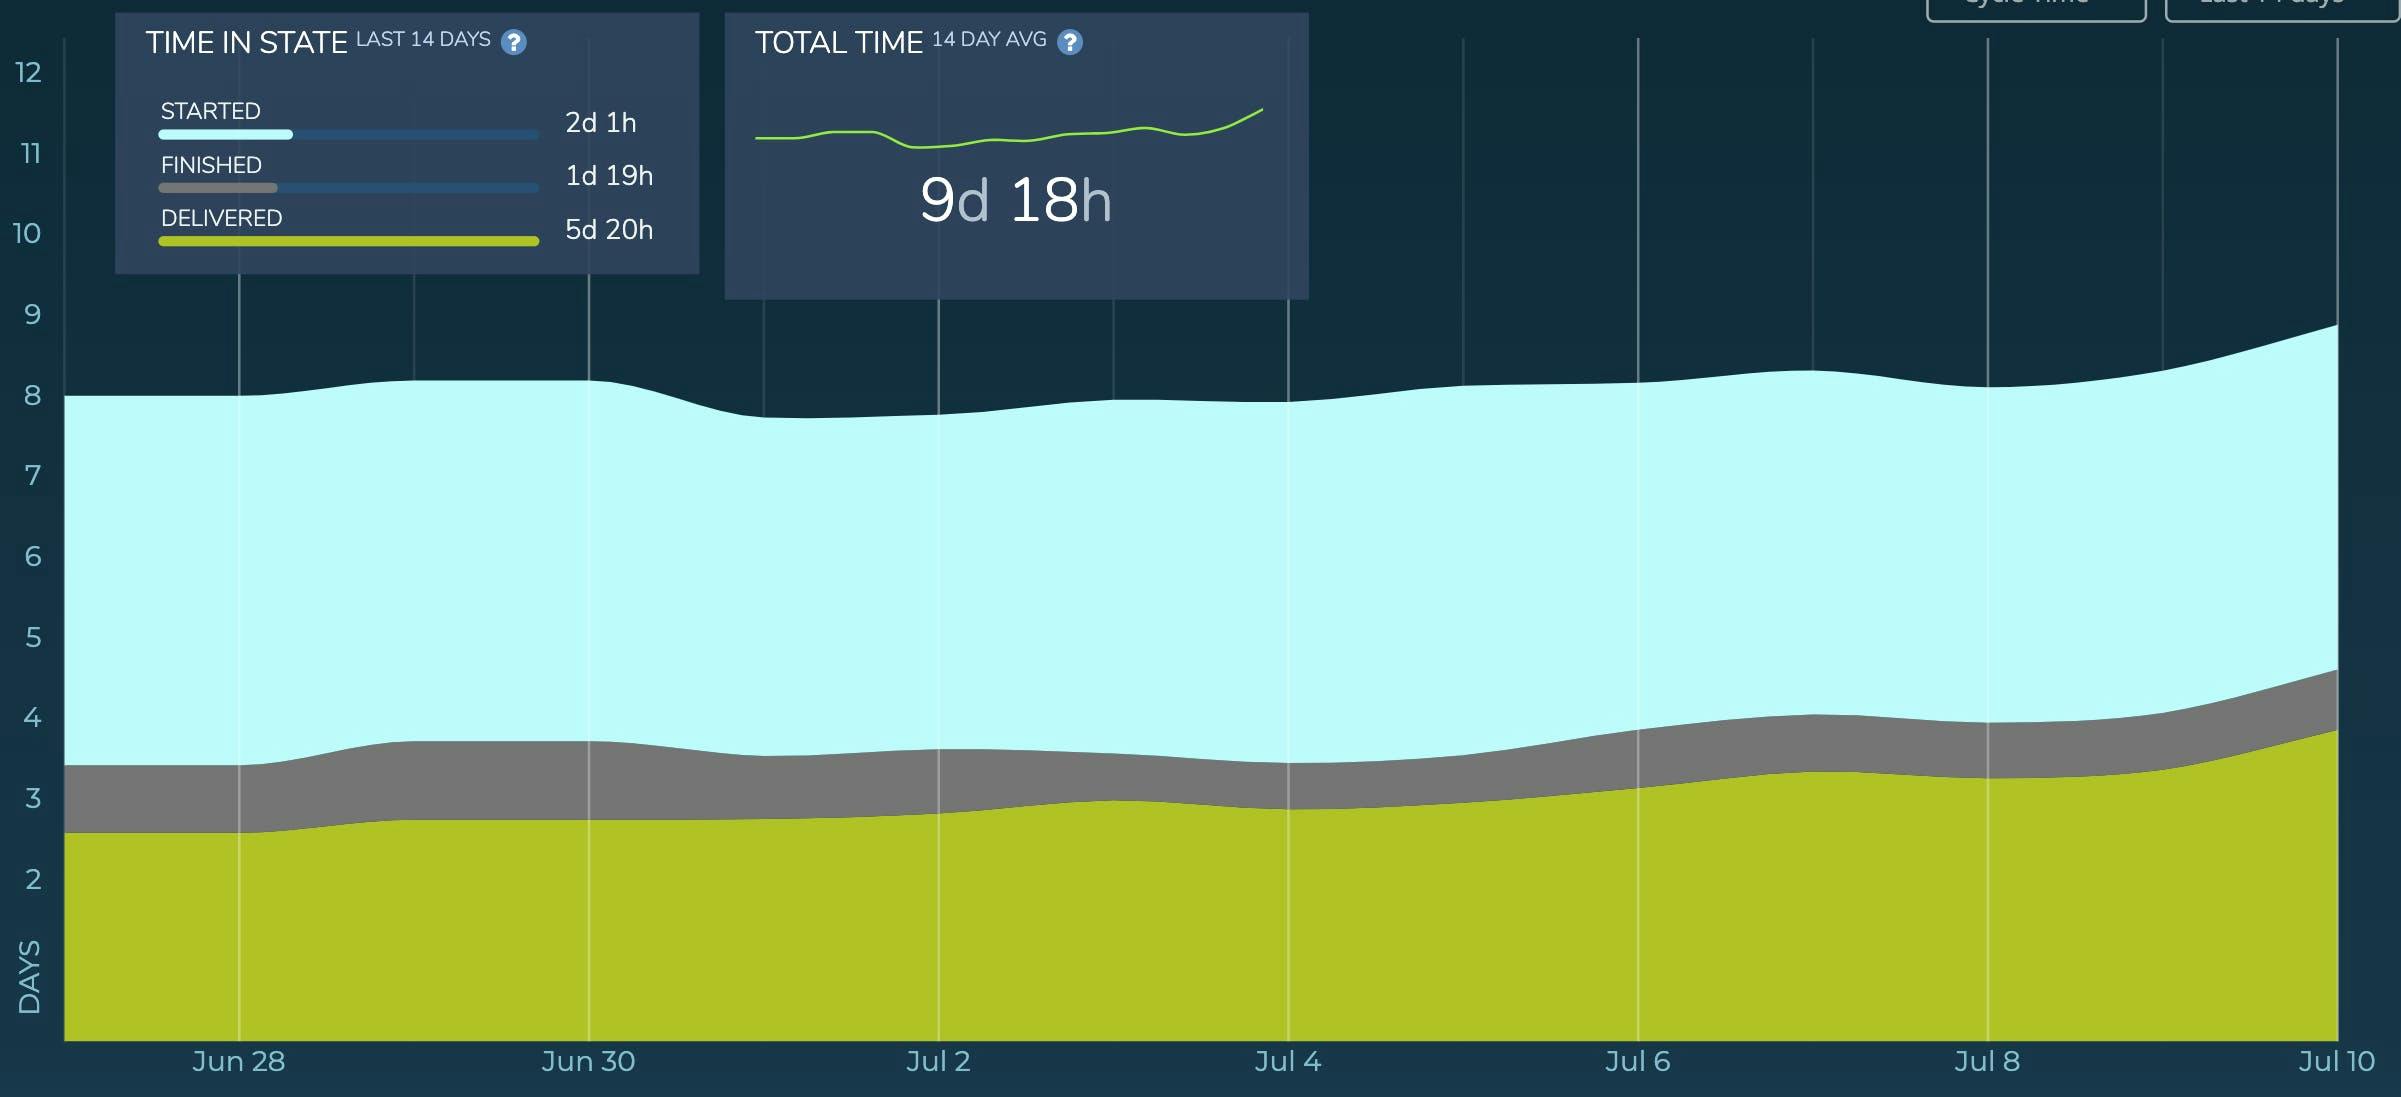
How do we read this chart? The y-axis displays time, this represents the number of days it took the team to complete a task. The x-axis displays the day of the week, this represents the day that task was finished.
Looking at this chart we can deduce three things
- The task constantly stays in the start state for an average of two days
- The task constantly stays in the finished state for an average of two days
- However, tasks are staying in the delivered state for five days and we can see a slight spike around 10 July
So in a team retrospective, I would have several questions
- What specific task or group of tasks caused this spike on 10 July?
- Why are tasks stuck in the delivered state for five days?
- Is there anything we can do to speed up tasks in the delivered state?
- Is it because stakeholders are not accepting the stories fast enough?
StakeHolder Satisfaction

The main reason we build software is to deliver value to end-users. So it only makes sense to take into account how the end-user feels about the software we deliver.
Some questions we can ask the customer in a survey can range from
- Are our end users happy after we delivered a certain feature?
- Did your revenue go up after the new feature was delivered?
- Are our end users engaging more with the features?
Using tools such as MixPanel, Hotjar, and Google Analytics can give you more insight into how new features are being used. More revenue or more engagement from end-users is a good way to gauge interest and customer satisfaction.
Meeting Time
Meetings can either be productive or a time suck. But what is true is that development stops during a meeting. So the more time you spend in meeting the less time you can create new stories or fix bugs.
So take a look at your team calendar and see if you have too many meetings. This should spark the question of — do we really need this many meetings. If not consolidate or cut out meetings that are not needed.
Be careful when you do this so you don’t remove or consolidate critical meetings that a team might need to bond and get to know each other.
Support Requests
Whenever you build a piece of software, there’s always a need for maintenance. This usually comes in the form of frequent interruptions to the team in the form of urgent requests to run a query.
The team can start to track the number of any requests that get submitted. Multiple requests could be a signal to
- Improve the product design
- Improve any broken process
- Too many bugs in the system.
One critical question a team can ask during a retro is, “can these support requests be handled without ever reaching the development team. Do we need better documentation?”
Time Spent on Bugs

How much time does your team spend on bugs, features, or random requests?
Engineering and building software requires a lot of focused work. Interruptions can and do decrease productivity.
Therefore, tracking how often your team has to drop what they are doing to fix a bug will give you insight into what processes you can put in place to avoid interruptions.
Sometimes it can be as easy as creating a rotation where team members are on call to fix bugs so the rest of the team can focus on delivering features.
Personal Data
Because we have people at the forefront of delivering a product while working together as a team. This is very important data to measure and take into account during a retro. Just having unbiased data without personal data will only give you half of the picture if your goal is continuous improvement of the team and process.
Personal data includes opinions, feelings, and any emotions of the team. There are lots of data points we could consider here but let's go with these:
- High and lows
- Went well, improve
- Employee survey
Highs and Lows

Team members are humans and they go through various emotions throughout the day, week and months. Sometimes they are happy and motivated, while other times they’re frustrated.
Recognizing these states is very important because it will have an impact on the team's productivity.
Being able to combine unbiased data and personal data is key to understanding the true nature of a problem. Let’s take for instance during the COVID pandemic, the team's velocity drastically took a nosedive.
This is a good opportunity to take into account a reduction in velocity or cycle time with the fact that the pandemic has an emotional effect on how the team delivers a feature during the same time period.
My philosophy is to foster an environment where people can openly air feelings — positive and negative. If you avoid it, it will kill team motivation and energy eventually.
Went Well, Improve, Action

This is the time to ask questions about these three topics. There's more on the effective retro format here.
- What went well: things the team should do more or continue doing
- What can we improve: things a team felt went okay and they liked but could be improved.
- What didn't work: things the team just didn't like and would not want to continue.
After all these questions have been answered, pick one or two areas to focus and discuss action items.
Employee survey

These are the most straightforward and easiest ways to gauge a company’s health. As a team leader, you can look at these survey results and get a good view of why your team engagement is high or low.
Therefore in the next retro, you could ask questions about why they are feeling very excited about working for your organization. What could be done to improve employee satisfaction?
These insights are important in knowing why your team is generally meeting or not meeting deadlines, having high or low energy, and working productively.
In conclusion
What could go wrong with gathering and using data during a retro?
Never bring data that focuses on individual team members such as data on who committed code that created a massive bug that eventually brought down production. Retros are supposed to be a place where a team learns to grow and fix problems, not a place to point fingers and blame an individual team member.
Do not share data outside without permission — bad data can be abused and misused. Also, data without proper context can be very detrimental to the team. A good example is velocity. Some teams see velocity as the speed at which a project is delivered. If shared with stakeholders or management, this could be good (if it’s used to add value for the team) or bad (if the team is judged against it).
Data can be very useful in solving all your team’s needs. It can definitely help your team discuss what is most important. It can also give your team a shared understanding of what happened and eventually lead to solving the core issues.